Plausible: Powerful website audience segmentation and visitor analysis
The one thing that has always helped Plausible grow is sticking to the needs of a specific set of web audience. When we started as a simple-enough and privacy-first way of tracking website traffic, we automatically started appealing to individual creators.
As we grew and improved our tech and product, and stuck with our philosophy of rejecting surveillance capitalism while providing a really easy, but useful, tool to use, we noticed an uptick in the customer base that were small startups and tech founders.
This clarity helped us steer the product and business decisions: like which features to build on priority, what pricing to set, etc., in the right direction.
It’s been seven good years in business and we understand the importance of data that can answer the single-most important question to businesses, whether they are new or evolving, “Who is our audience?”
It makes sense to analyze your website traffic to understand such insights since it’s a fair presumption that both existing customers and potential customers must have visited your website at some point, at the very least.
- What is audience segmentation?
- What a web analytics tool can reveal about audience segmentation
- How to segment audience in your Plausible dashboard?
- Making the most of Plausible for audience segmentation
- Plausible Analytics is uncomplicated, privacy-first, accurate, lightweight.
What is audience segmentation?
While Plausible anyway gives you basic and reliable data on visitor traffic, it can come in hundreds or millions of numbers. Either way, it is next to impossible to make meaningful sense of it without creating some subgroups that can be studied.
That is audience profiling and segmentation in a nutshell, i.e. when you filter out your available website visitors’ data to create “segments” that can be studied to answer meaningful business questions and take defining decisions and/or create marketing strategies.
The use cases and depths of analyses can greatly vary though. Say, an independent journalist may want to know about the number of unique visitors to their website, segmented by cities they get in a month and a year. This clarity could help them personalize their research work, language and writing style to the cities that show the most interest in their work.
Similarly, a SaaS business team may have additional requirements and could want to know about the website audience segments taking specific actions on their site and converting. They could also want to drill further into that to understand which channels such converting web audiences typically came from in a given period of time.
Whereas, a large e-commerce platform might be interested in tracking complete, detailed customer journeys, from initial product views to final purchases, across different product categories and marketing campaigns.
The interesting thing to note is that if you are in business, you’d definitely be having some audience segments, whether you are aware of them yet or not. It’s worth exploring them.
So, let’s understand how and what audience segmentation tools or more specifically, a web analytics tool can tell you about your segments of audiences.
What a web analytics tool can reveal about audience segmentation
No matter the depth of audience segmentation analysis needed, any segment is built with a mix and match of the three basic questions:
- How did the audience find us (channels of acquisition, marketing campaigns)?
- What they were like (devices used, demographics they come from)?
- What they did on the site (pages visited, actions taken, conversions met, etc.)?
In a web analytics dashboard, like Plausible or Google Analytics, these common audience insights take the shape of:
- Geographic segmentation
- Traffic Acquisition segmentation
- Technological segmentation: devices, browser, OS data
- Behavioral segmentation: Page views, events and engagement data
This eventually helps build answers to important business questions. For eg. “How many visitors from the United States signed up last year?” or “Is our site more popular with mobile users or desktop users in Germany?” or “Do the visitors reaching our site from X (Twitter) visit the pages we want them to?”
By answering such questions, you can make decisions based on real data. Say, you identify that, for your e-commerce store, the mobile traffic has seen a spike in the last six months while the cart abandonment has been high too. You may want to consider creating a cutting-edge mobile app.
Or say, you discover that traffic from UAE has shown a lot of interest in a new feature you had launched. Then, you might want to target your marketing campaigns towards that audience.
But answering such questions first requires breaking the available audience data into segments so that they can be analyzed to answer such questions.
Continuing the example from above, if you could access the segments of UAE visitors AND the landing pages they visit the most when they arrive at your website, you could join these data sets to answer specific questions or discover new and valuable insights.
In Plausible, this is as easy and quick as applying a few filters on your simple, elegant, single-page dashboard.
How to segment audience in your Plausible dashboard?
In Plausible, your audience data is already presented in basic segments like channels of acquisition, landing pages they visit, their demographics, and the devices they use. This is all done by default, out-of-the-box.
When you have a Plausible dashboard open, clicking on any entry (or entries) filters the dashboard to show only the data pertaining to those filters. You can also save a segment for quick access later.
If you don’t have a Plausible Analytics account yet, you can play around with our live demo where our own website’s real data is publicly available. The following examples are fetched from the same dashboard, and you can try the explained filters for yourself on the live demo.
Example: Free Trial visitors from Twitter, USA (excluding CO, MN, AZ)
If we wanted to segment the audience that came to our Free Trial registration page, from Twitter, from the USA (but excluding the regions of Colorado, Minnesota and Arizona – maybe because we ran paid ads in those regions and only want to understand organic traffic), in the year so far, then we would get this:
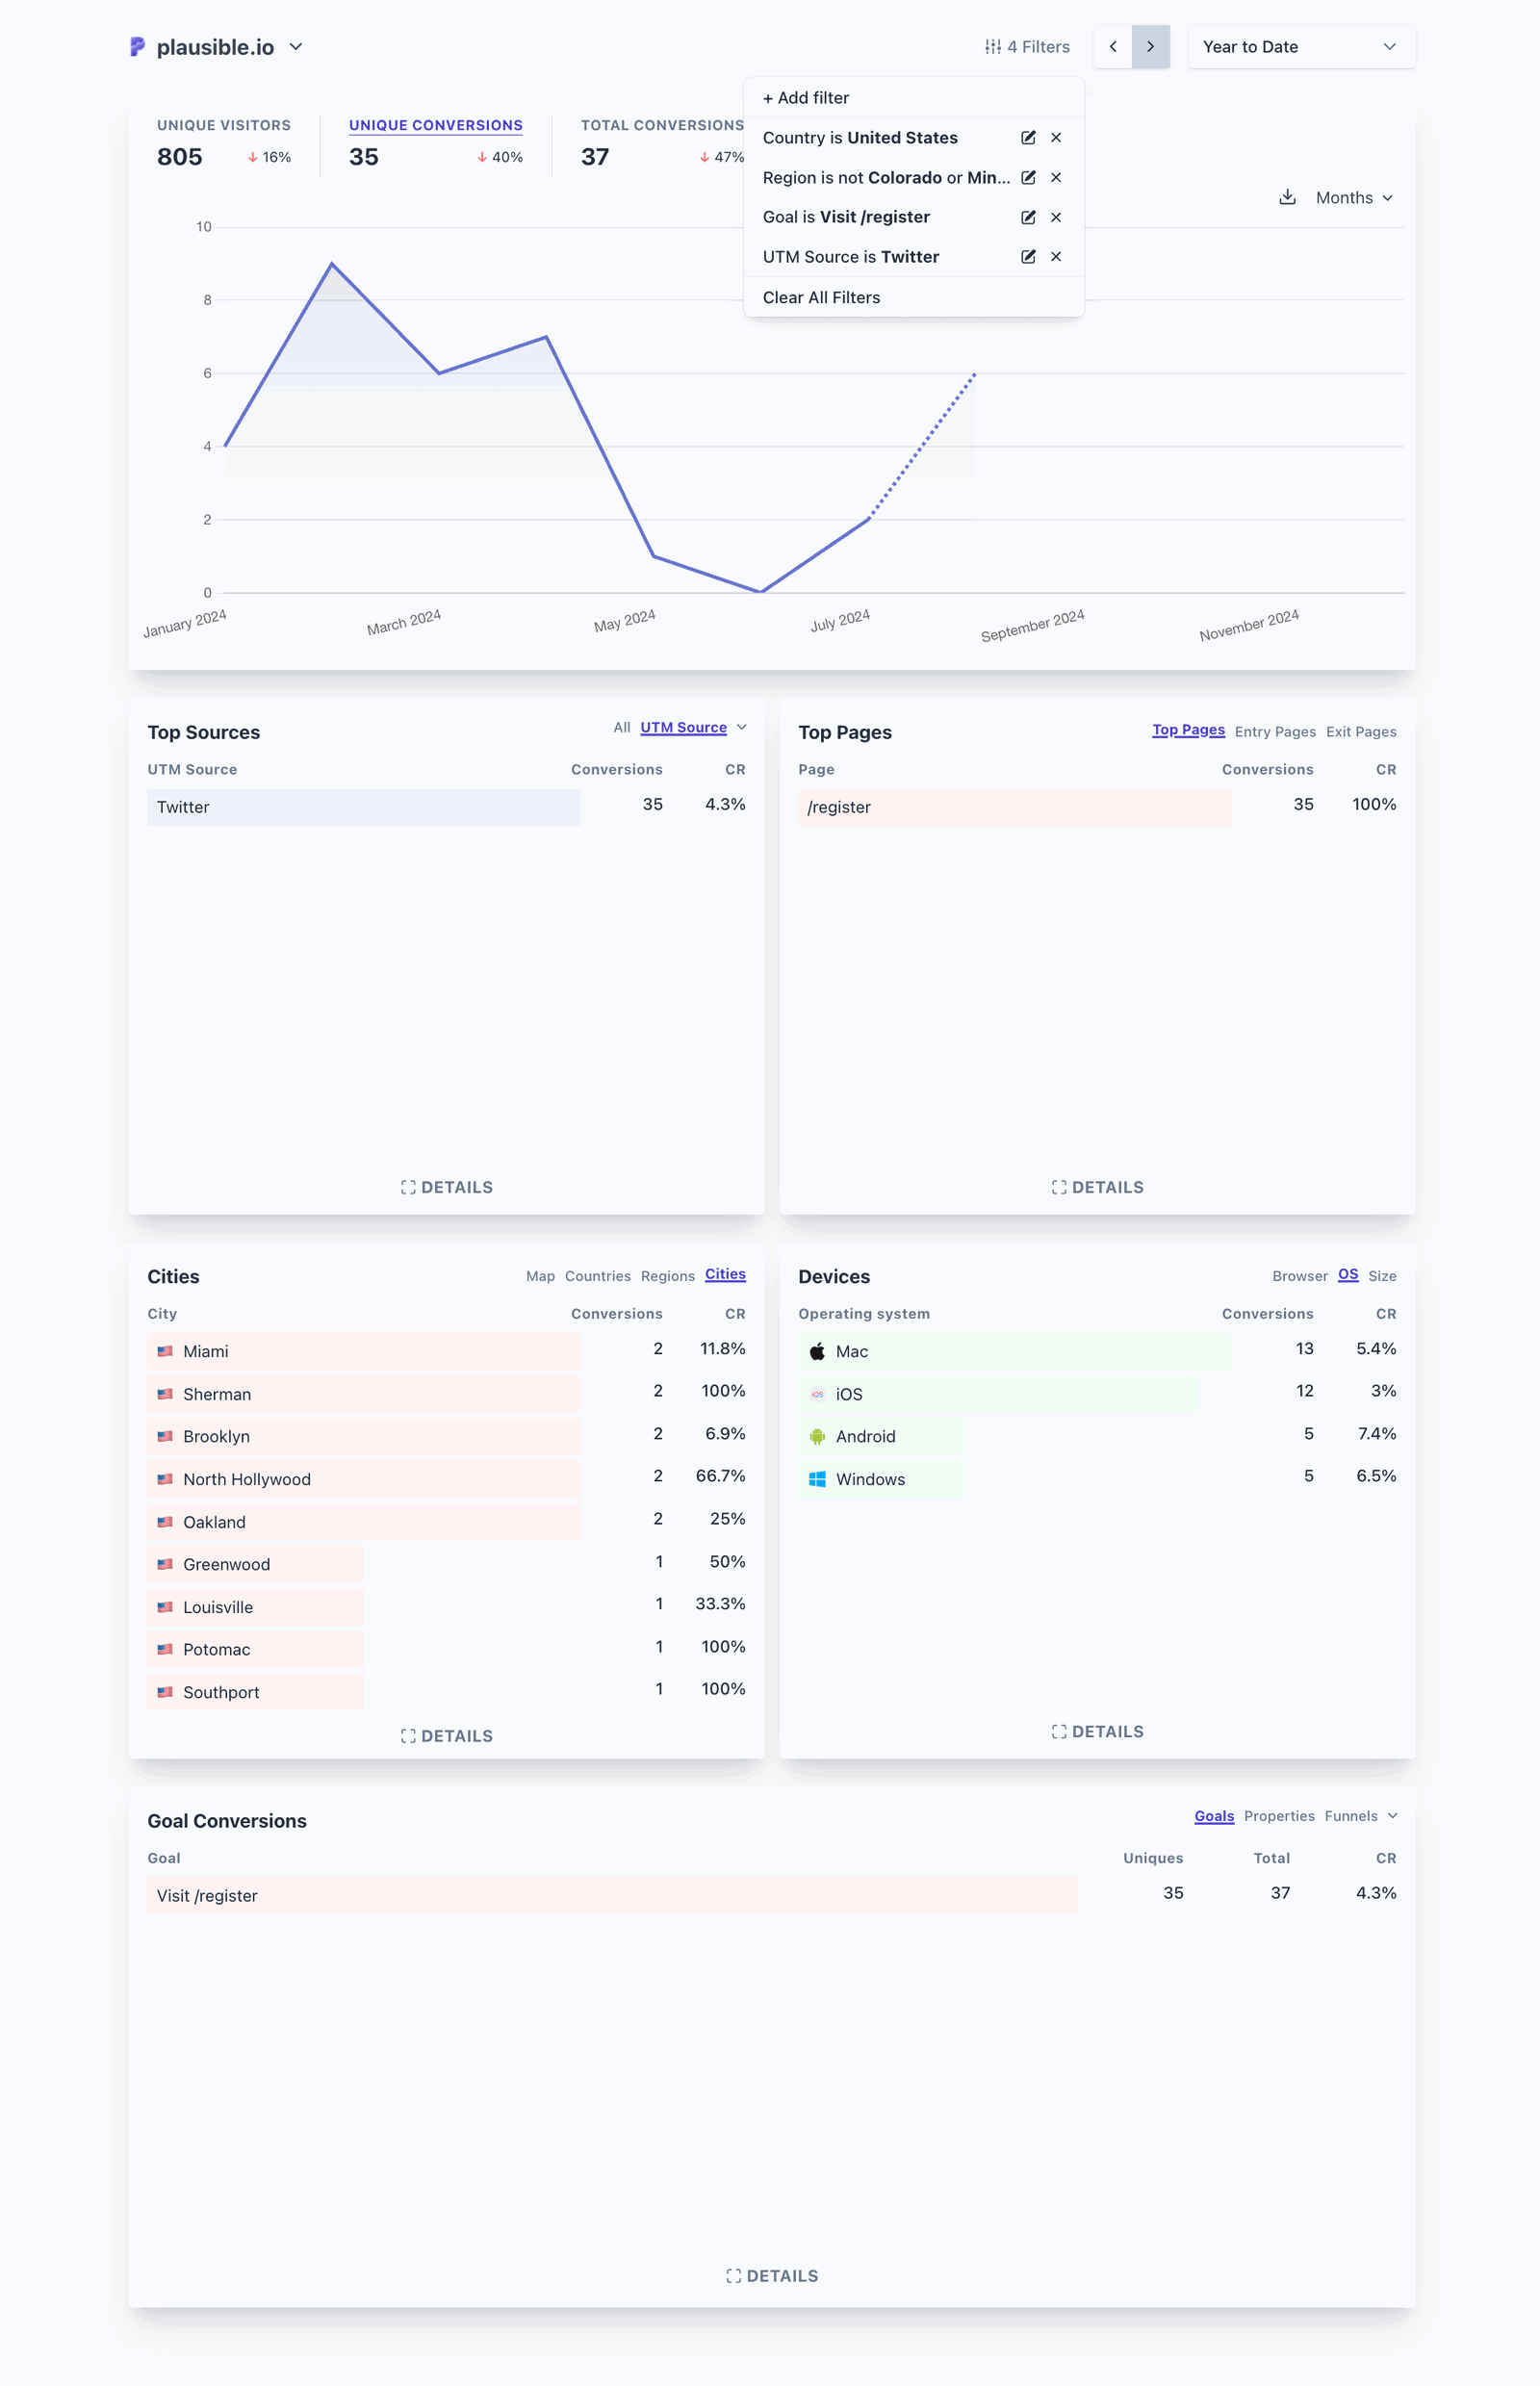
You can check out this exact audience segment on our filtered live dashboard for yourself.
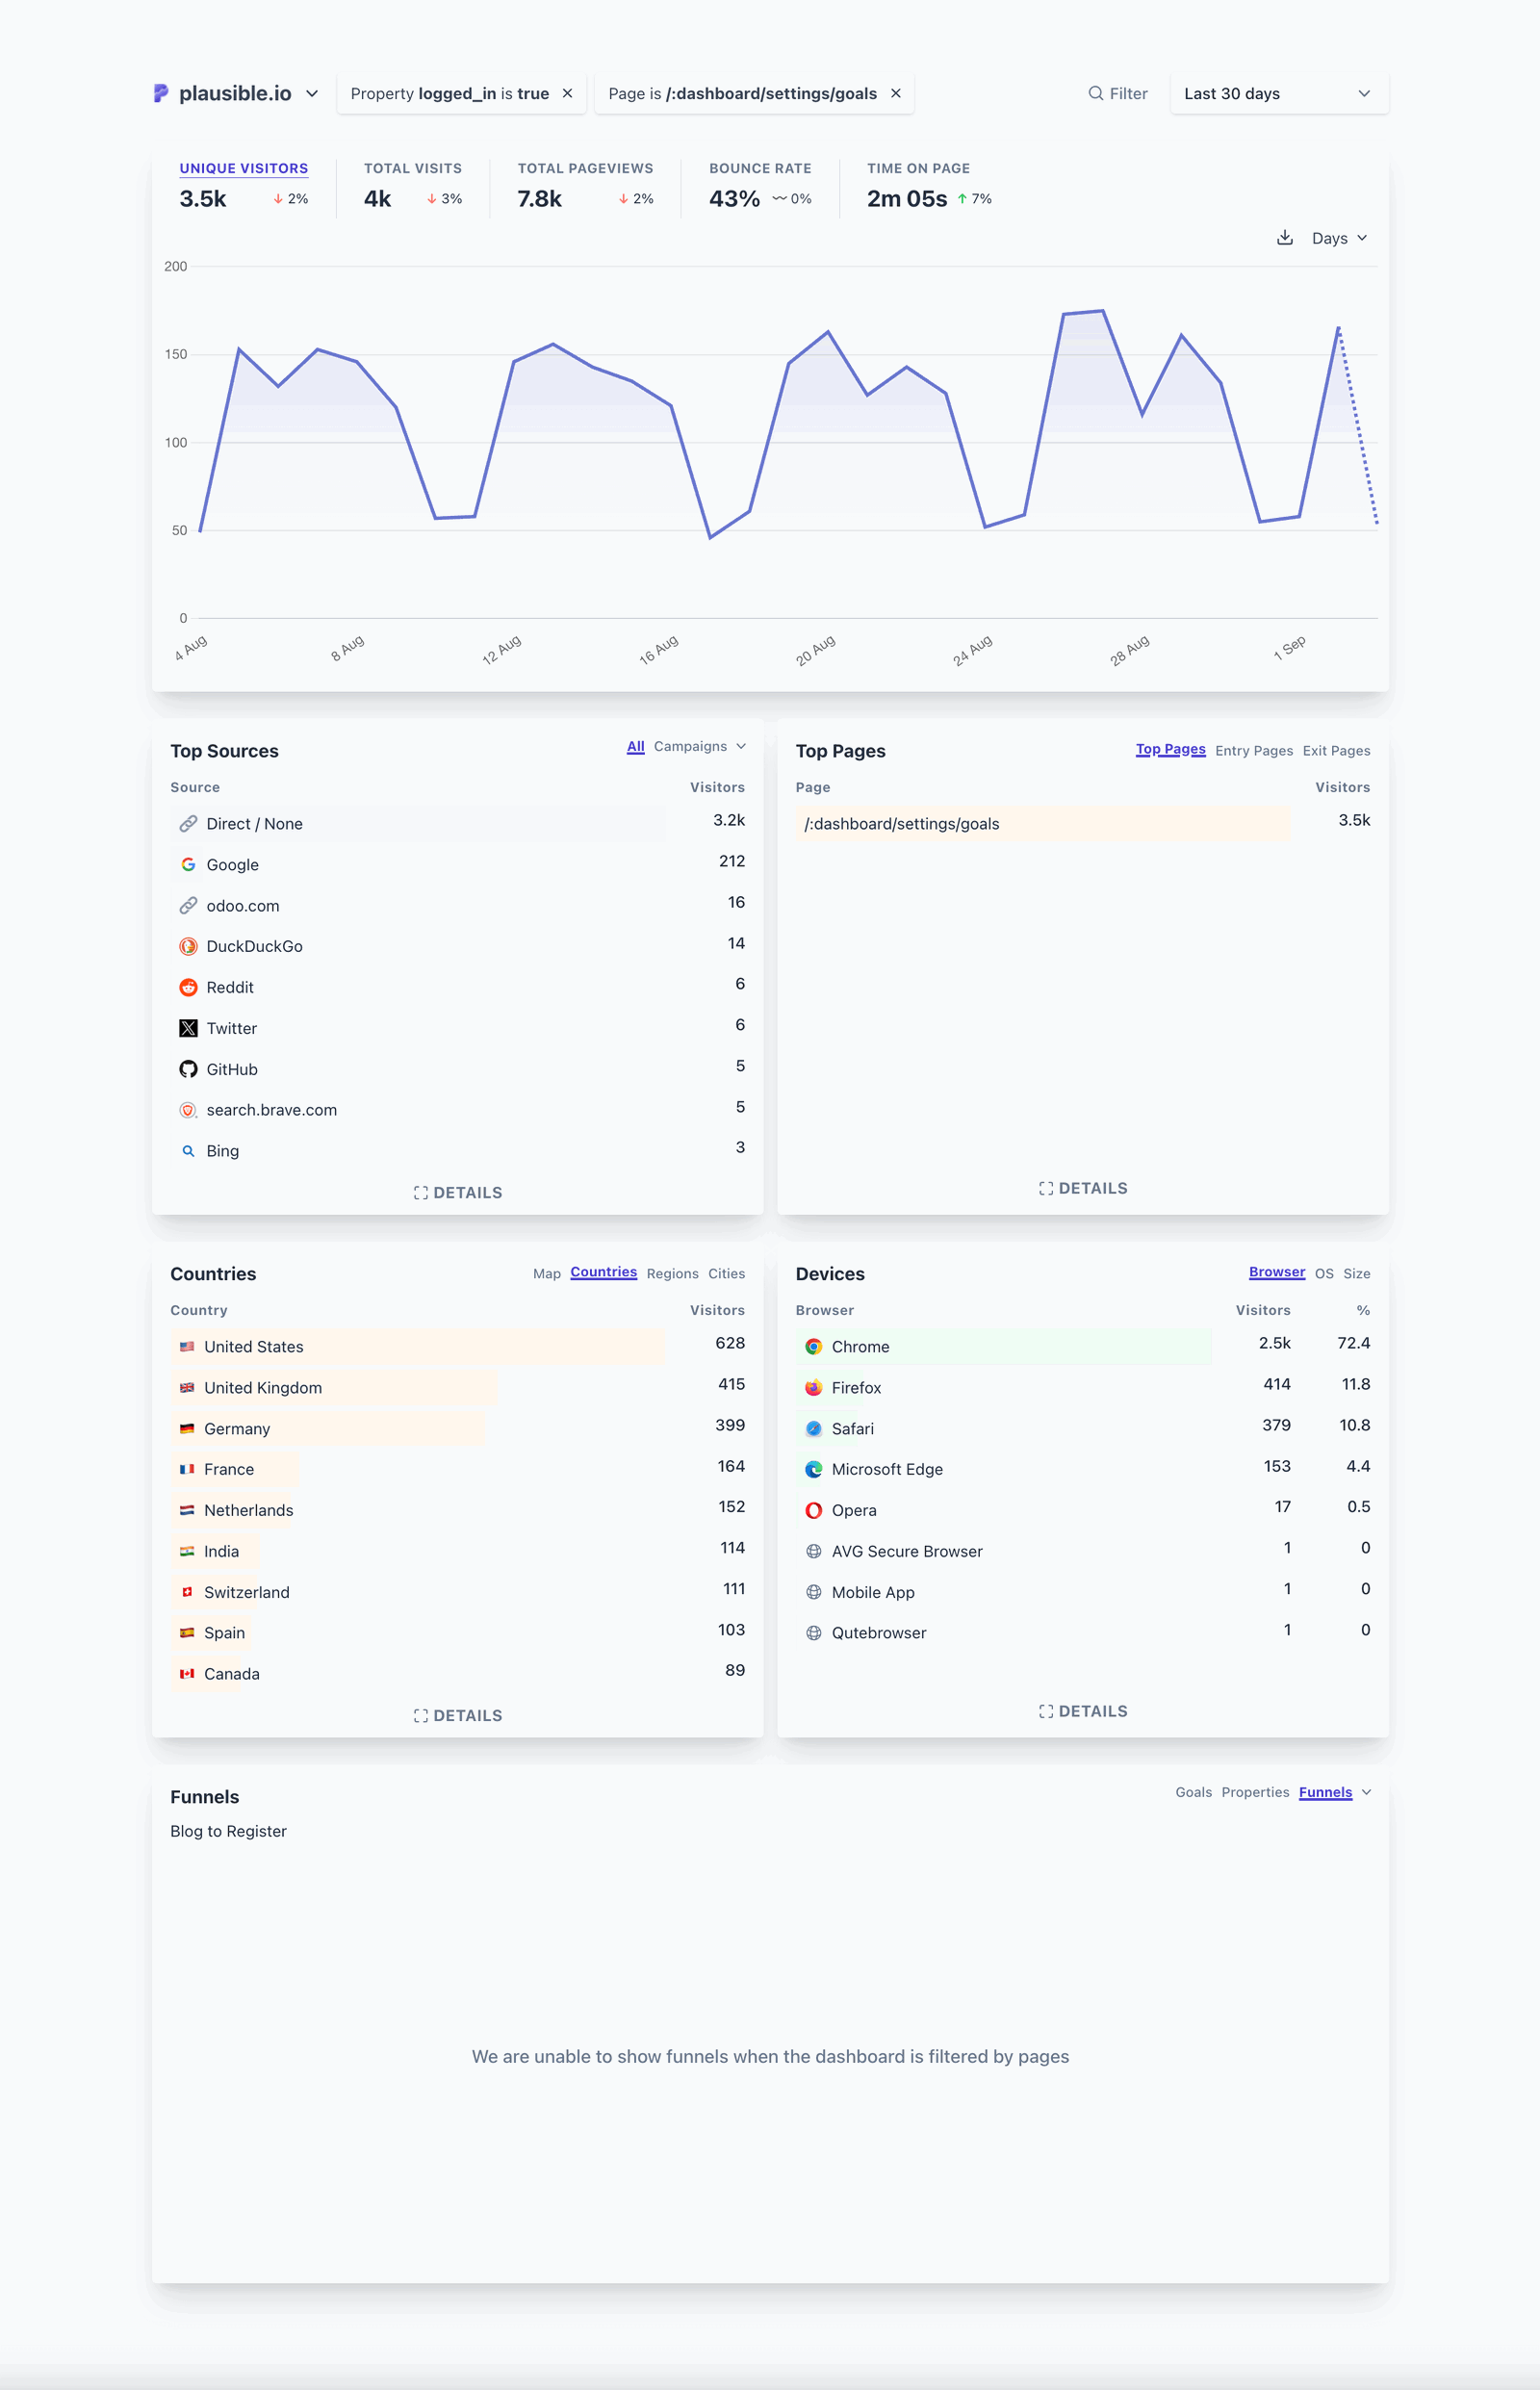
Example: Logged-in users who viewed the Goals Settings page
Looking at active users (filtered using a custom property) who viewed the Goals Settings page (filtered using a “Top Pages” report entry) can show how many people are interested in setting up the feature, or are at least aware about it.
This way, we can improve the user experience and tailor marketing strategies.
Example: UK users who upgraded to paid subscription, in the year so far
This segment tells us how many paid subscriptions (a custom goal) we have got from the United Kingdom (a location) in the year so far, and what the conversion rate looks like.
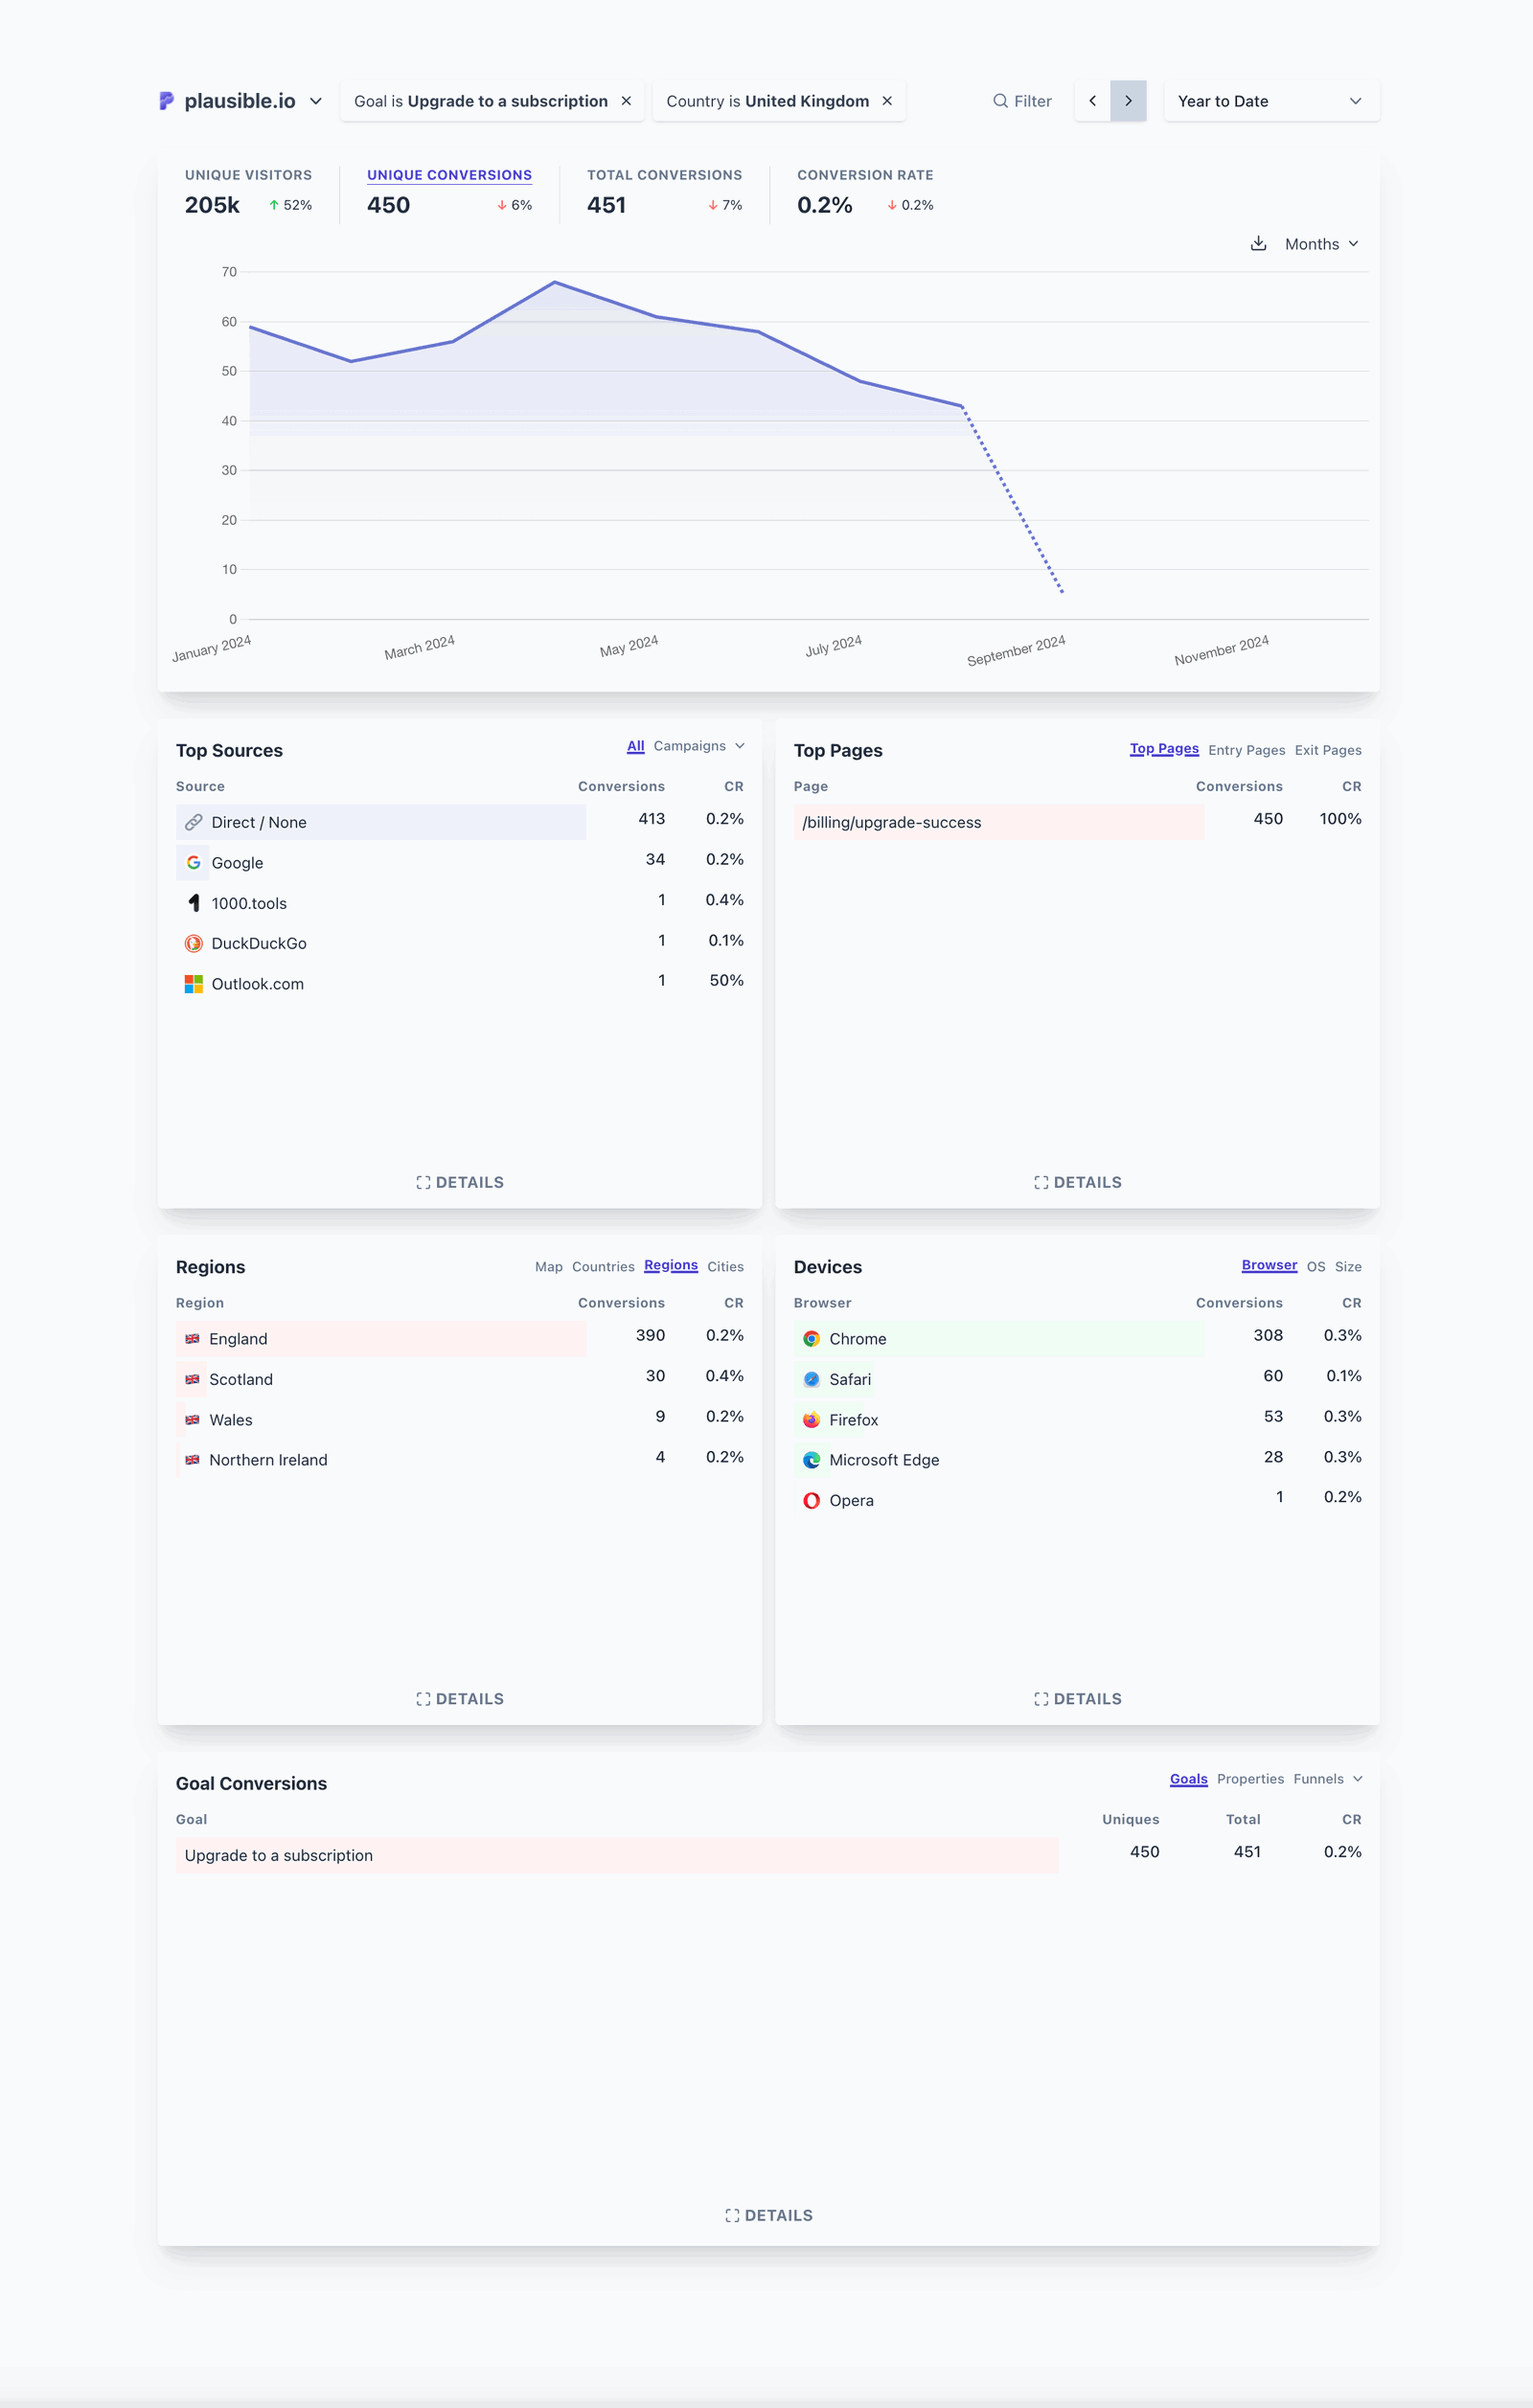
By analyzing this report further, valuable decisions can be made. For eg. We can see that England contributed to the most amount of conversions from the United Kingdom, and that Chrome has been the most popular browser.
This way, if we wanted to run an ad campaign, we could have easily segmented the target audience by those two factors. Running an ad campaign without this insight could have cost us a lot of money wasted on other types of audiences.
Example: Author page views
Another, fairly simpler, use case for creating an audience segment can be to understand which of your blog authors (custom property) generate how many page views and on which blog posts. This can be helpful in understanding the effectiveness of their writing.
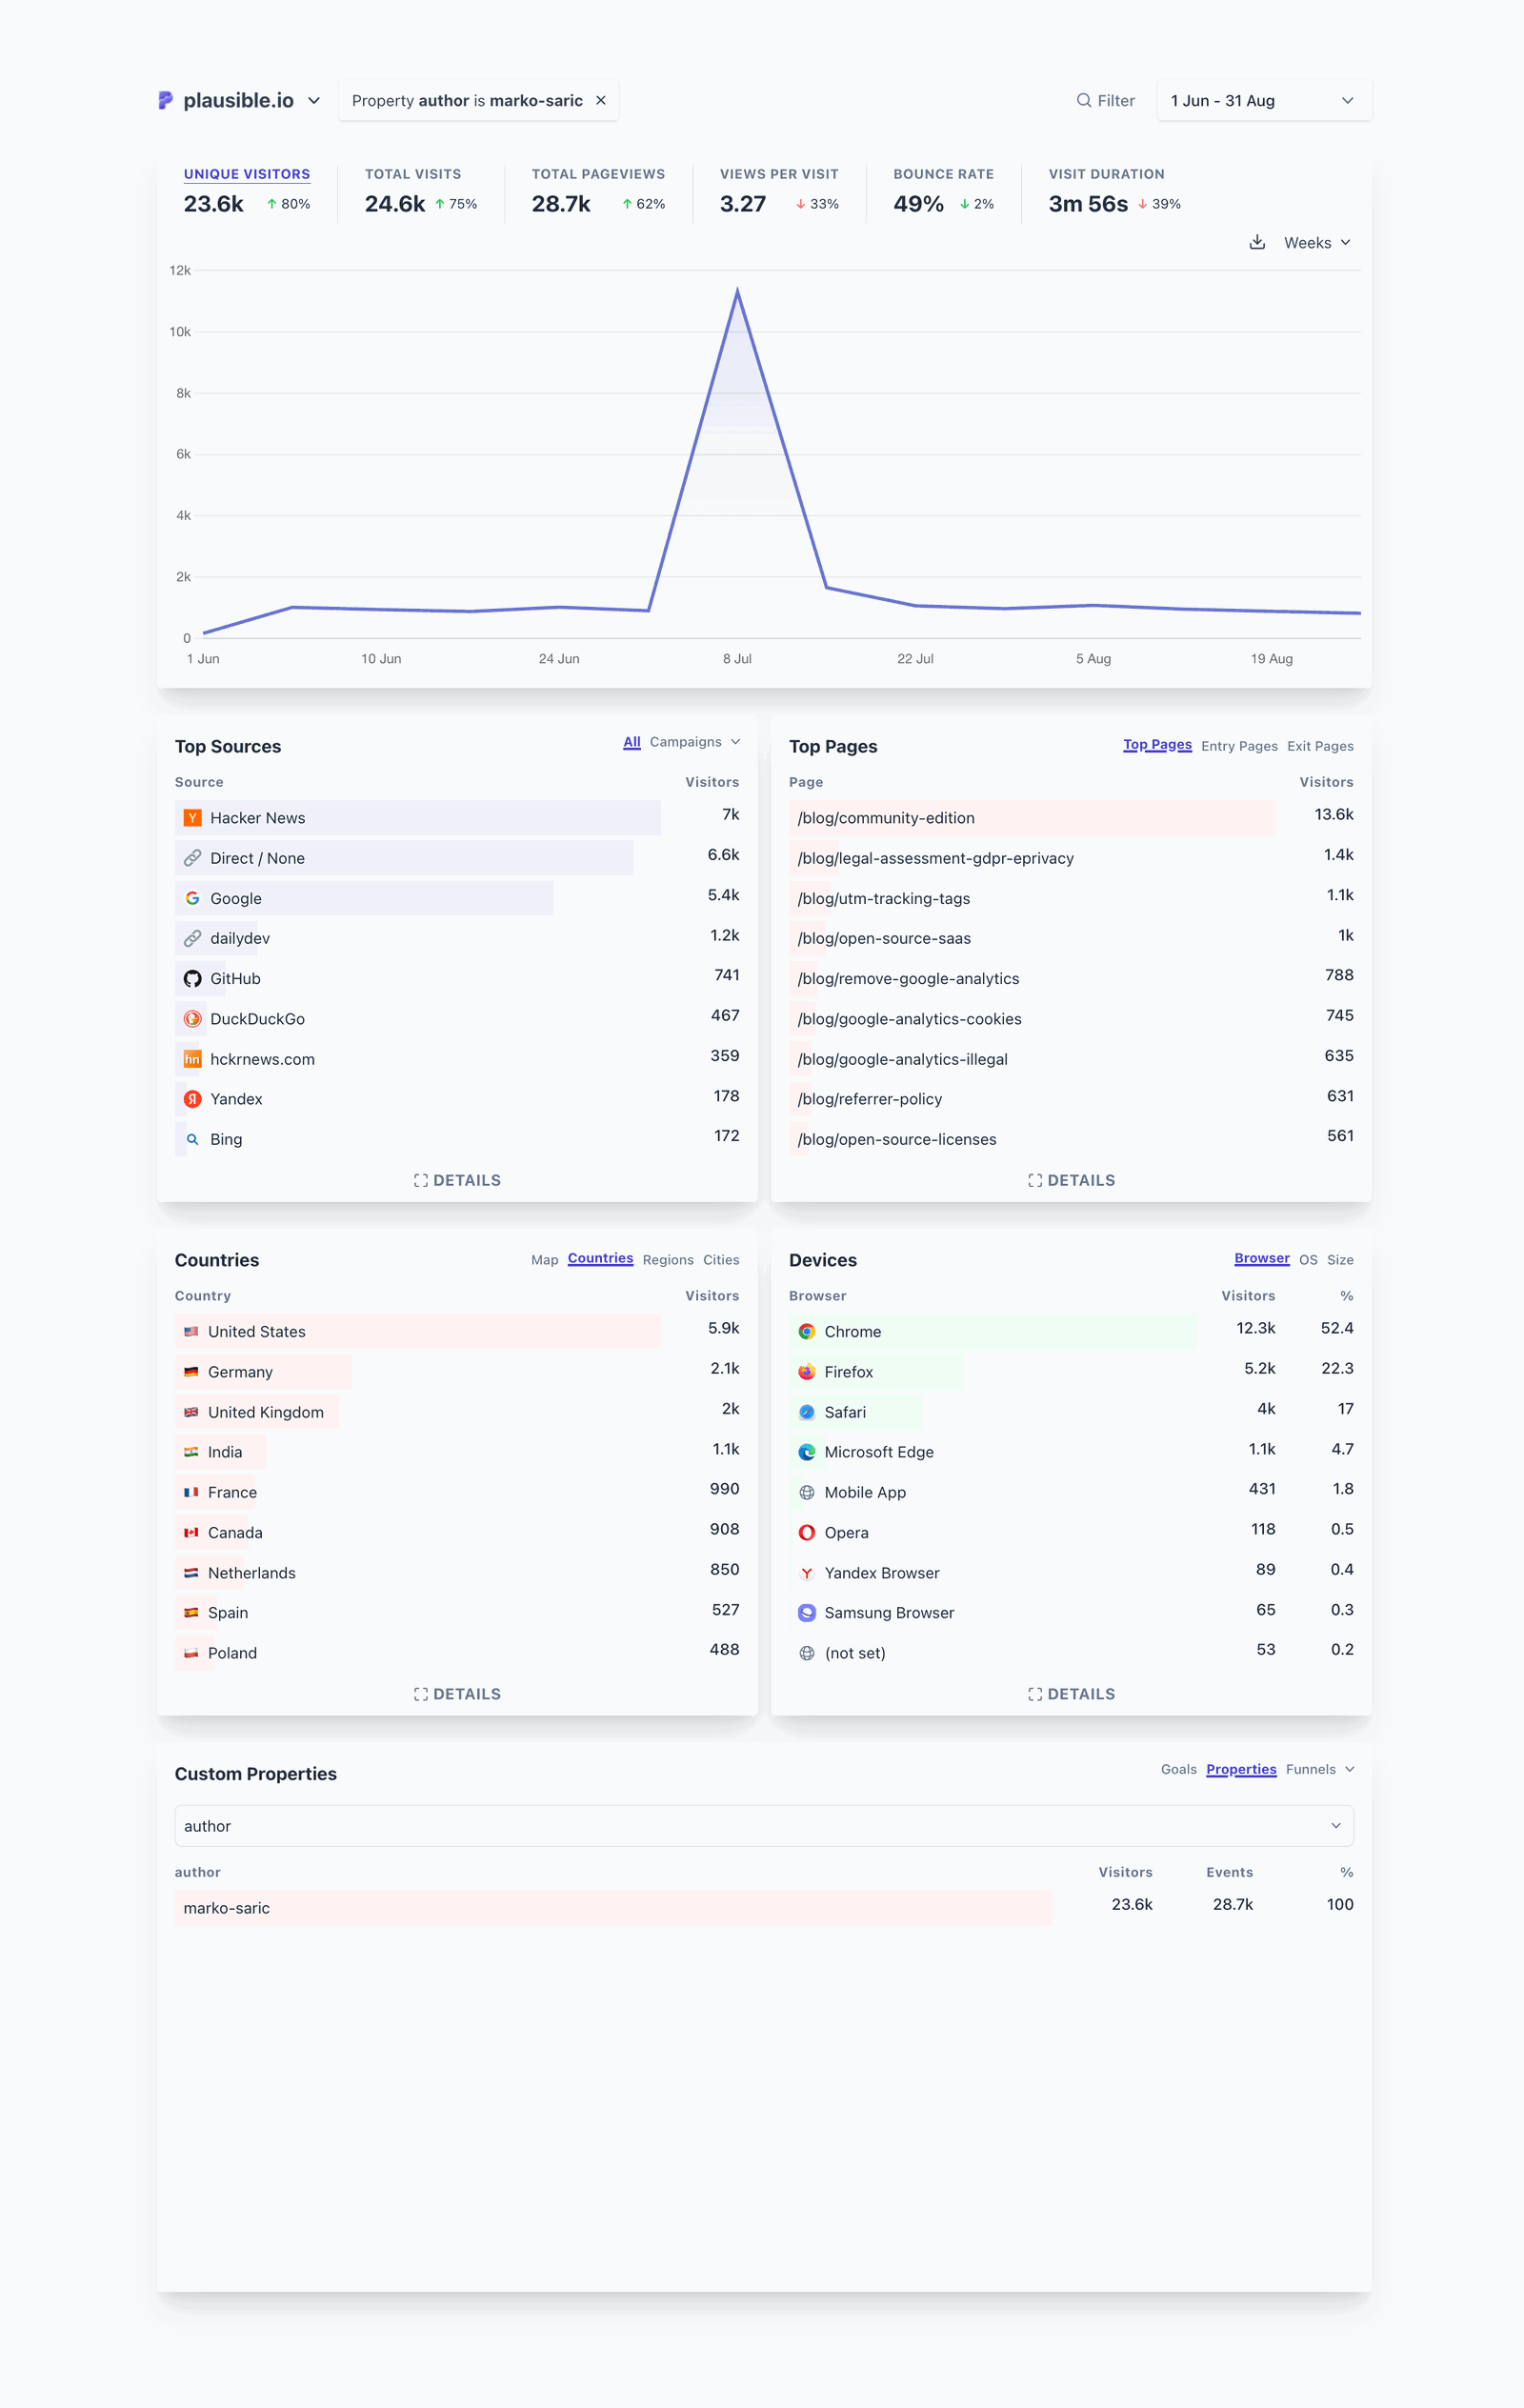
Similarly, you could have simply understood which pages rank for which keywords from Google. This brings us to the next section: making the most of Plausible.
Since tracking additional stuff like the interactions happening on your site, the contribution of marketing campaigns in acquiring visitors, the role of SEO in it, etc. is not something we can track by default (since it is all personalized to your use case), some additional steps are required.
Hence, there are certain best practices that we recommend considering to make audience segmentation a piece of cake. Let’s explore below.
Making the most of Plausible for audience segmentation
This is an overview of the things that Plausible users normally do to have a good amount of data available. You can decide on which features to use based on the filters you’d like to use and the depth of audience segmentation analysis you would need.
You don’t have to guess that in one go, though. We offer a 30-day free trial (no credit card info needed) where you can test out ALL the features and make an informed decision.
For segmenting based on traffic acquisition: leverage URL Parameters
Plausible provides clear insights into where your audiences are coming from. Whether they arrive from social media, search engines, direct visits, other websites, or any other source, referral source data helps you segment your audience by how they found your site.
When posting links (from your site) to other platforms like social media, paid ads, newsletters, etc., make sure to tag them with special query parameters like ref, source, utm_source, utm_medium, utm_campaign, utm_content and utm_term.
Plausible automatically captures these parameters, and you can view the segmented data under the “Top Sources” section.
You can also click on any of these items to filter the entire dashboard by a traffic acquisition source so you can view data only about sessions acquired from that particular source (or sources) in a specified timeframe.
This also comes in handy for analyzing the performance of different marketing campaigns or understanding which channels drive the most valuable traffic.
For segmenting based on site interactions: track custom events
Another powerful way to segment audience is by setting up custom events. With events, you can track specific actions visitors take on your site, such as signing up for a newsletter, clicking a call-to-action button, or downloading an ebook.
By capturing site interactions, you can identify different audience segments based on their behavior.
There are various methods in Plausible to track such events (some not even requiring code edits) like enhanced measurements, pageview goals, and custom event goals.
You can also collect additional, contextual data about events with custom dimensions to create custom metrics. And later, you can also compose goals into funnels to get a broader overview of entire customer journeys.
This also comes in handy in understanding which actions your audience is taking and which of them lead to conversions, helping you better target your marketing efforts.
For segmenting based on SEO performance: integrate with Google Search Console
We offer an integration with Google Search Console to help you understand the search terms that led visitors to your site. This data is directly in your Plausible dashboard. This makes it easier to understand which keywords are driving real traffic.
You can segment this data by filtering your dashboard with the “Google” traffic source entry. This gives a deeper insight into the clicks originating from Google search results.
The best part? This integration is privacy-friendly and requires no additional Google code on your site. Google simply shares the search data they’ve already collected, ensuring your site’s privacy remains intact.
Other optimizations
- Save your segments for quick access later.
- If you have some old data from Google Analytics 4 that you don’t want to lose, you can simply import it into Plausible. This ensures you retain those critical insights, which can be essential for segmenting your audience and understanding long-term trends.
- You can allow traffic only from specific hostnames to not pollute your data.
- Plausible strips the query parameters from the pages reports for privacy purposes. If you want some pages to be reported with the complete URL that includes the query part as well, here’s what you should do.
Plausible Analytics is uncomplicated, privacy-first, accurate, lightweight.
We have designed Plausible keeping in mind the way web analytics should have always been done. It is not unnecessarily complicated.
Plausible’s private-by-design solution is fully compliant with GDPR, CCPA, and PECR regulations. We operate without using cookies/persistent identifiers and don’t collect personally identifiable information. We ensure you maintain 100% ownership and control over your website data.
Unlike other analytics tools, Plausible does not track or sell user behavior, so you can skip cookie banners. This provides a smoother experience for your visitors and less headache for site owners.
Our tracking script is lightweight. This helps prevent website slowdowns often caused by larger scripts and ensures a great experience for your customer base (also great for SEO).
We also filter out referrer spam, data center traffic, and accurately attribute mobile traffic from apps like Gmail and Slack. We exclude ~32K data center IP ranges (i.e. a lot of bot IP addresses) by default, preventing bot traffic from inflating your stats.
For eg., Cookiebot CMP users see a constant spike in their direct traffic because their sites are scanned constantly by the Cookiebot’s bots, requiring manual exclusions in GA4. There are other similar instances, but Plausible handles them all automatically for you.
We are also not blocked by a lot of ad blockers and privacy-focused browsers like Safari and Firefox.
Google Analytics is not what you think it is.
Google Analytics 4 is a default choice for many site owners. When it comes to audience segmentation analysis, “Audiences” begins as a setting in a complex settings panel and ends up in the “Free Form” reports.
In Google Analytics 4, you can create different audience groups based on user behavior. These groups let you organize users who visit your site in specific ways. You can then use these audience groups for things like retargeting ads in Google Ads.
The issue with that is that the phasing out of third-party cookies has rendered the whole process very inefficient. Even though the phase-out has been delayed, most users still reject cookies, which keeps this problem very much alive. We’ve covered these issues in more detail in another article.
Moreover, recent independent studies have shown that the data tracked in Google Analytics is not accurate, missing as much as 55% data in comparison to Plausible!
And, GA4 is not GDPR-compliant, is known to profile your users and sell their data, requires a learning curve and compromises your web users’ experience. We explain such things and the differences between Plausible and Google Analytics in detail here.
Do you have a website? We encourage you to sign up for a 30-day free trial with no obligations and explore our simple and privacy-friendly website analytics dashboard.